Secure Spread Spectrum Watermarking for Multimedia (Cox et al., 1997)
Cox and colleagues embed an identification sequence in an image’s perceptually significant spectral components: frequency coefficients that strongly affect its appearance. They spread small changes across many coefficients and use the original image to recover the sequence after processing. The authors argue that these components matter because compression and other operations tend to preserve them while discarding less visible information. Their aim is an unobtrusive identifier that survives distribution and resists attacks involving several marked copies. Cox et al., Secure Spread Spectrum Watermarking for Multimedia (1997).
What problem should the watermark solve?
An image can be copied after an authorized recipient decrypts it. Encryption controls access; the authors seek identification that remains within the distributed image. The mark may identify the work or the purchaser of a particular copy.
Section I sets requirements for unobtrusiveness, survival through processing, and resistance to collusion: combining differently marked copies to suppress their identifiers. The authors also require unambiguous identification and resistance to forging another person’s mark. Their image algorithm embeds a real-valued sequence and tests whether a candidate sequence is present. They state that ownership claims also require authentication and cryptographic mechanisms, since another party could add a different mark.
Why select large coefficients from the whole-image DCT?
A mark confined to high frequencies can disappear during compression or shrinking. Section III argues for placing it in components that processing must preserve to retain image fidelity. The discrete cosine transform (DCT) represents brightness as weighted spatial patterns; each weight is a coefficient. Low frequencies describe slowly varying brightness.
Sections III-A and IV-A specify these insertion steps:
- Compute the DCT of the entire original image.
- Select the n coefficients with largest absolute values, excluding DC, the constant-brightness component.
- Generate a random watermark with n components and modify the selected coefficients.
- Return the modified values to their positions and apply the inverse DCT to reconstruct the marked image.
The authors say the selected coefficients usually correspond to low frequencies. Selection by magnitude also admits negative coefficients. Their choice is a heuristic for perceptual significance, which means importance to visible image content. Section VI leaves perceptually grounded coefficient selection as an open problem.
Why draw independent Gaussian values?
Several recipients could compare their copies and exploit a restricted set of possible mark values. Section IV-E explains that discrete marks can expose components whose values agree across copies. The authors therefore use independent Gaussian values: normally distributed real numbers with mean zero and variance one. The mean is the average; variance measures squared spread around it. Independence means that drawing one component gives no information about another.
Section IV-D uses that distribution to analyze chance matches with an unrelated candidate. Section IV-E also analyzes averaging independently marked documents. The extracted average retains contributions from the constituent marks, while additional noise can reduce their detector responses at a cost to image fidelity. The authors’ security argument depends on the mark distribution and the attack.
Why multiply each coefficient by a mark-dependent factor?
A fixed additive change can be too small for a large coefficient and too disruptive for a small one. Section IV-B proposes scaling the change with the original coefficient. Its equation (2), used throughout the experiments, is:
v'_i = v_i * (1 + alpha * x_i)Here v_i is an original selected coefficient, x_i its watermark component, v’_i the modified value, and alpha the strength parameter. A shared alpha produces changes proportional to coefficient magnitude.
Take four illustrative selected coefficients (200, -150, 120, 90) and mark values (1.2, -0.5, 0.8, -1.0); the method uses 1,000 coefficients. With alpha = 0.1, insertion gives (224, -142.5, 129.6, 81). With no attack or rounding, extraction returns the same mark values. The detector response is about 1.825 for that mark and -0.877 for the different illustrative candidate (0.5, 1.2, -1.0, 0.8).
How do watermark length and strength affect distortion?
Small individual changes are vulnerable to processing noise. Section IV-C analyzes spreading the mark across additional components. Under an additive independent Gaussian-noise model, quadrupling the number of components permits halving each modification, with essentially unchanged total squared deviation. This is a model-based tradeoff between spreading and per-component strength.
The authors use n = 1000 and alpha = 0.1 throughout Section V. Section IV-B1 considers separate strengths for coefficients with different perceptual tolerances, but the experiments use a single strength. Section VI states that reducing strength improves fidelity while reducing robustness. The sequence can index a database record; its length need not equal the number of information bits associated with that record.
How does the detector decide whether a candidate is present?
Processing changes the embedded coefficients, so recovery yields a distorted sequence. Sections IV-A and IV-B use the original image to identify coefficient positions and reference values. Registration aligns the received image to that original before extraction. Inverting equation (2) gives:
x*_i = (v*_i / v_i - 1) / alpha
sim(X, X*) = (X dot X*) / sqrt(X* dot X*)
match if sim(X, X*) > T
Here v*_i comes from the received image, X is the candidate, X* the recovered sequence, and T a response threshold. A dot product sums paired products; sqrt takes a square root. Equation (4) divides only by the recovered sequence’s length. For an independent Gaussian candidate, the authors derive a normal response with mean zero and variance one.
“Of course, the number of tests to be performed must be considered”
— Cox et al. (1997), Section IV-D1
They give T = 6 as an example for a small number of documents. Testing additional candidates increases the chance of a false match.
Why process the recovered sequence before comparison?
Dithering, which represents tones with black-and-white dot patterns, can shift the recovered sequence’s average away from zero. Section IV-D2 proposes subtracting that average before computing the response. The authors attribute the improvement to reducing the denominator while changing the numerator only slightly.
They also discuss suppressing unusually large recovered components or retaining only each centered component’s sign: positive, zero, or negative. The print-copy-scan experiment uses mean removal followed by signs. The authors require a fixed, published extraction policy that depends on the original and received images. Any small set of alternative recovered candidates must be included in the false-positive calculation, which estimates accidental matches to an unrelated watermark.
All parts of the method
Insertion transforms the original image, selects significant coefficients, applies the multiplicative rule, and reconstructs the marked image. Detection transforms both the original and the aligned suspect image. The original supplies the selected positions and reference coefficients. Their relative changes yield the recovered sequence. A fixed processing policy may center or convert that sequence to signs before the detector computes its response to a candidate watermark. The decision compares that response with a threshold.
What experiments did the authors run?
The authors test uniqueness, scaling, JPEG compression, dithering, cropping with and without JPEG, print-copy-scan conversion, repeated insertion, and collusion by averaging.
Uniqueness
Section V uses the Bavarian couple image, credited to the Corel Stock Photo Library, with a Gaussian mark inserted into the largest non-DC DCT coefficients. This image and insertion setup carry through the experiments. Section V-A compares the marked image against 1000 randomly generated candidate watermarks, including the embedded one. Figure 6 has one dominant correct response; the authors interpret it as suggesting a low false-positive rate.
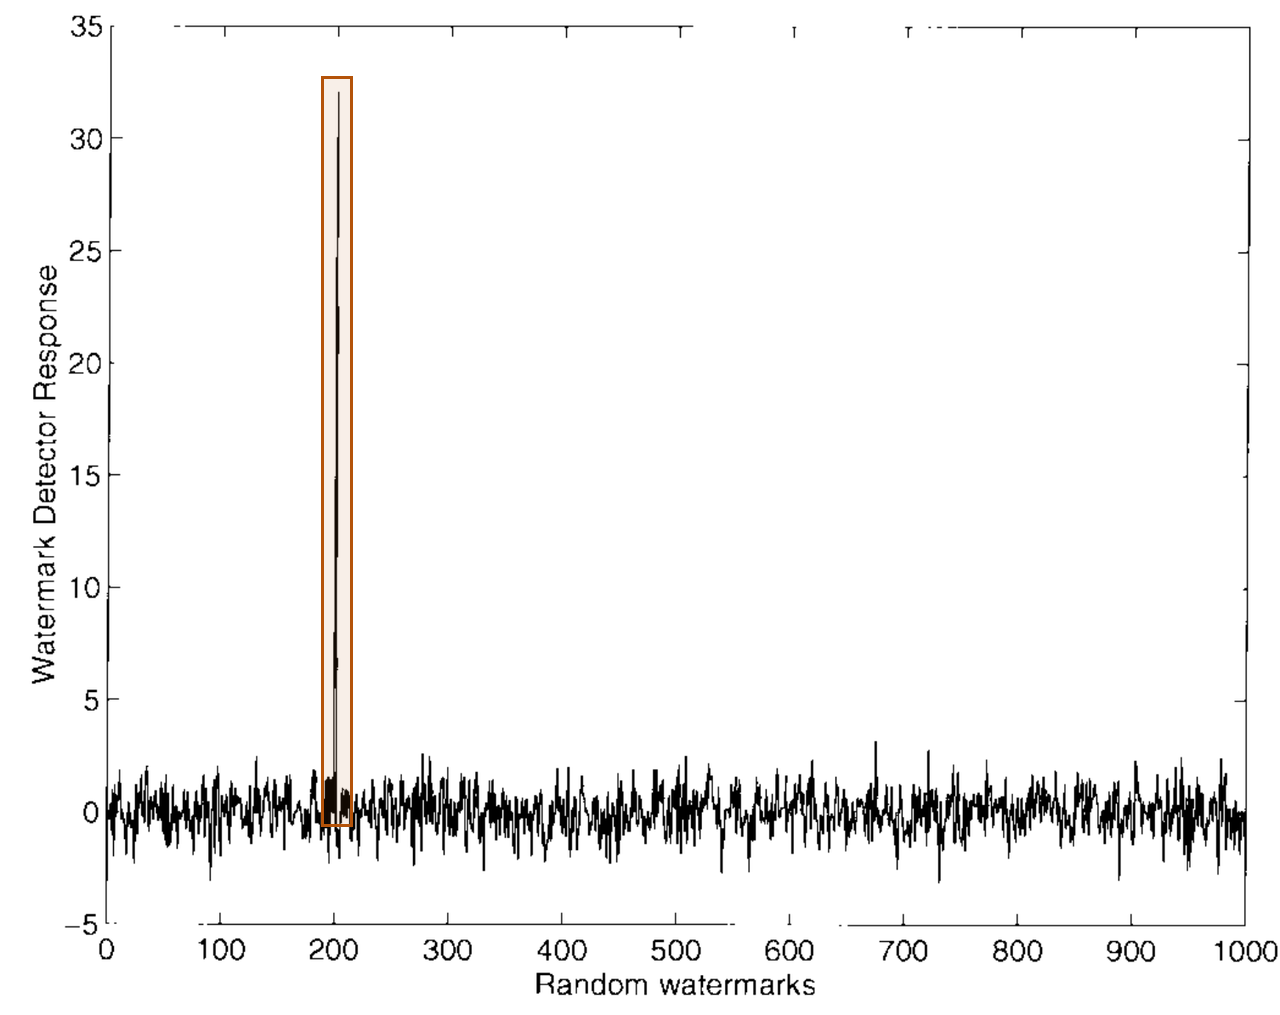
Cox et al. (1997), Figure 6. The embedded candidate’s response peak.
Scaling
Section V-B shrinks each dimension of the marked image to half its original size, then restores the original dimensions before extraction. Figure 7 describes lowpass filtering, which removes fine spatial variation during shrinking. The authors report a response of 32.0 before scaling and 13.4 afterward. The smaller image retains a quarter of the original data. They stress that registration to the original is crucial.
JPEG compression
Section V-C compresses the marked image at 10% quality with 0% smoothing, producing the image in Figure 8. The reported response is 22.8. A separate compression at 5% quality and 0% smoothing produces Figure 9 and a response of 13.9. The authors describe visible distortion at both settings and interpret the responses as evidence of resilience to encoding distortion.
Dithering
Section V-D converts the marked image to the dot-pattern representation in Figure 10. The authors report a response of 5.2 for the recovered sequence. Subtracting its nonzero mean raises the reported response to 10.5. They attribute this improvement to the recovered-sequence processing described in Section IV-D2.
Cropping and JPEG followed by cropping
Section V-E retains the central quarter of the marked image. It replaces the missing regions with pixels from the original unmarked image before extraction. The response is 14.6. The authors repeat this procedure on the JPEG image encoded at 10% quality and 0% smoothing; the response is 10.6. Both operations remove 75% of the marked image area. Figures 11 and 12 show the retained regions and restored images.
Print, Xerox, and scan
Section V-F prints the marked image, photocopies the print, and scans the copy at 300 dpi using a UMAX PS-2400X scanner. Dpi means dots per inch. It rescales the result to 256 by 256 pixels. The authors report a response of 4.0, rising to 7.0 after subtracting the recovered sequence’s mean and retaining only component signs. Figure 13 shows the processed image and its visible pattern noise.
Repeated watermark insertion
Section V-G applies five successive watermarking operations to the same image. The authors describe significant degradation as insertion repeats. They test 1000 random candidates, including all five inserted marks. Figure 15 shows five response spikes, which the authors interpret as identifying the marks despite repeated insertion.
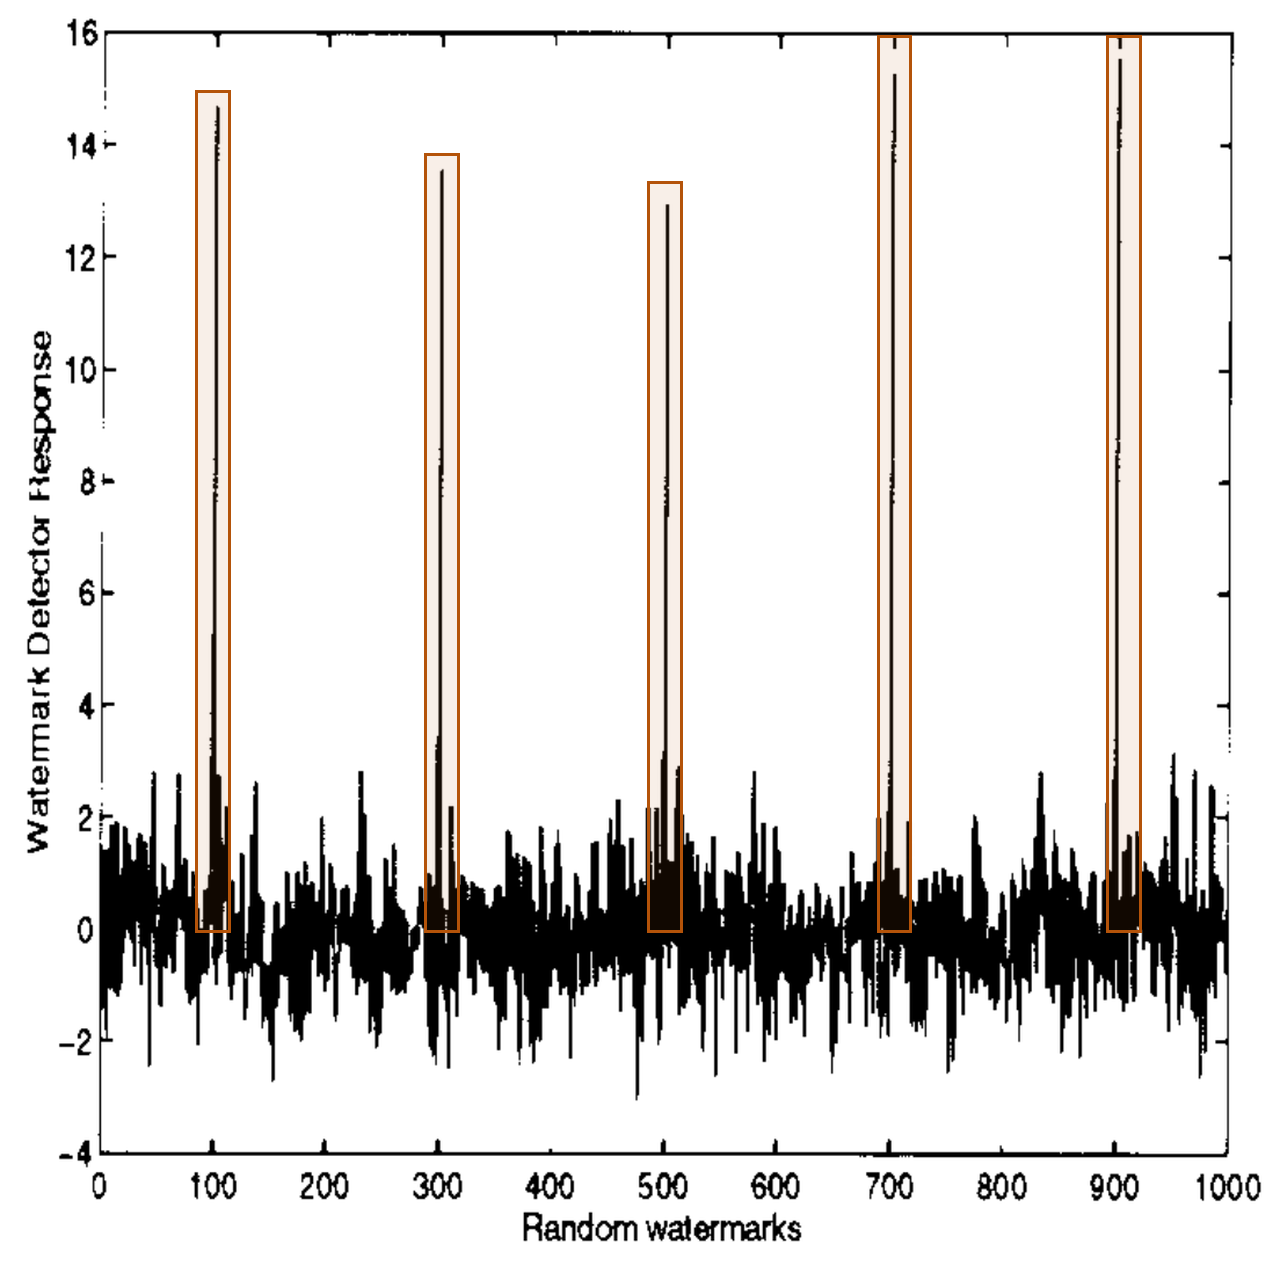
Cox et al. (1997), Figure 15. Five marks after successive insertion.
Collusion by averaging copies
Section V-H averages five separately marked copies of the same original image. The detector tests 1000 candidates, including the constituent marks. Figure 17 shows five spikes. The authors conclude that simple averaging of a few images is ineffective in this experiment. They call the experiments preliminary and state in Section VI that they performed no objective image-quality evaluation.
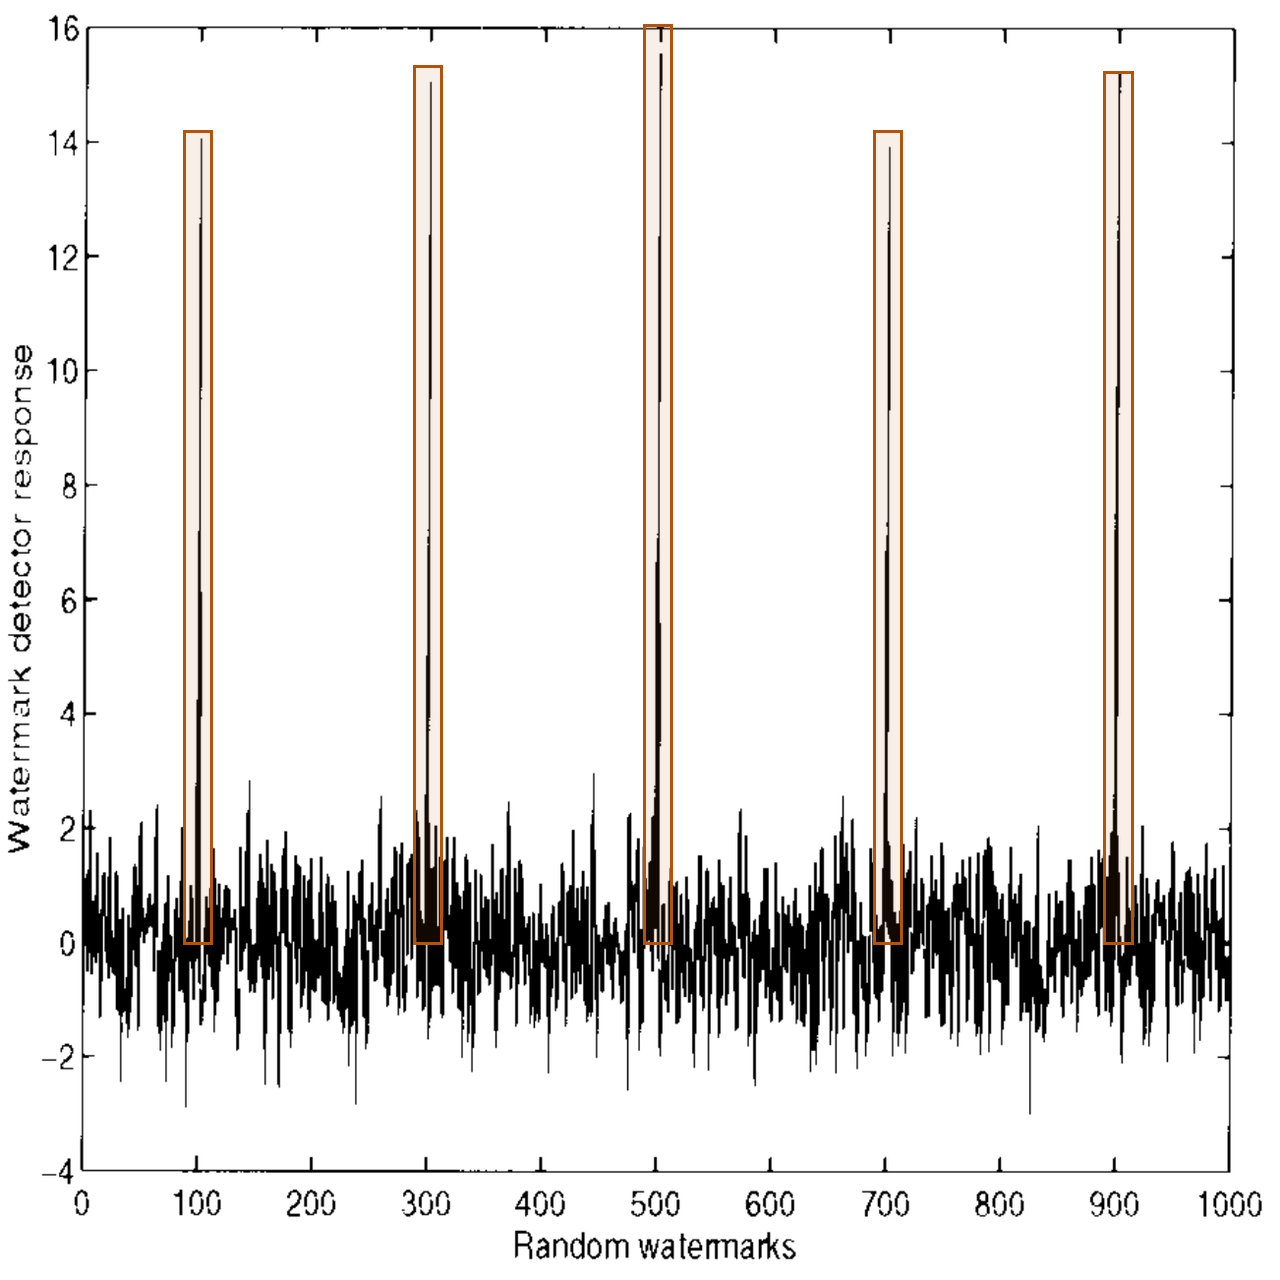
Cox et al. (1997), Figure 17. Five constituent marks after averaging.
Our test: Airplane and Boat under attack
We re-implemented the method ourselves because we did not find the authors’ experimental code. Our code and numeric results are on GitHub. We used one master seed.
| Setting | Value |
|---|---|
| Images | Airplane; Boat |
| Size | 256×256 grayscale |
| n; alpha | 1,000; 0.1 |
| Attacks | Scale, JPEG, dither, crop, combinations, multiple marks |
For our tests, we chose LANCZOS resampling, Pillow Floyd-Steinberg dithering, and fixed original coefficient positions for successive insertions.
We used USC-SIPI 4.2.05 (Airplane) and boat.512 (Boat).
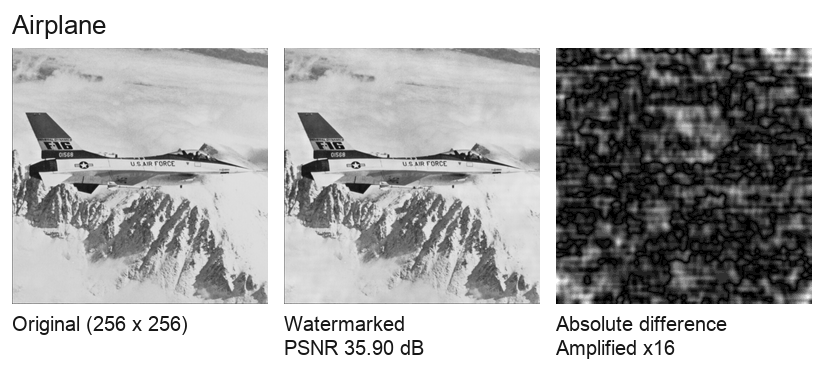
For Airplane, we measured a peak signal-to-noise ratio (PSNR) of 35.90 decibels (dB) between the original and the watermarked image. PSNR uses a logarithmic pixel-error scale.
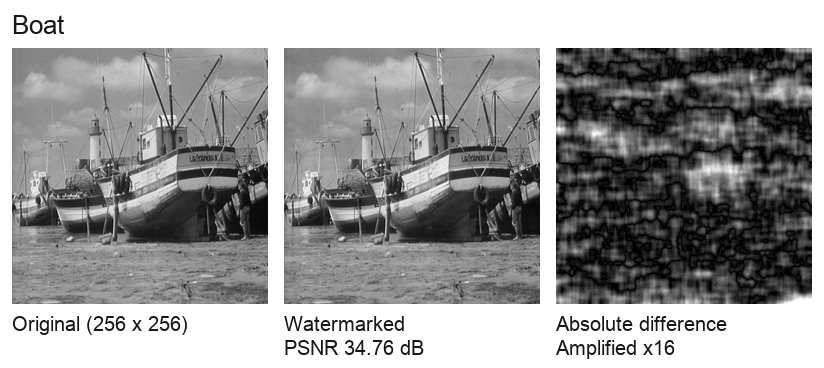
For Boat, we measured a PSNR of 34.76 dB.
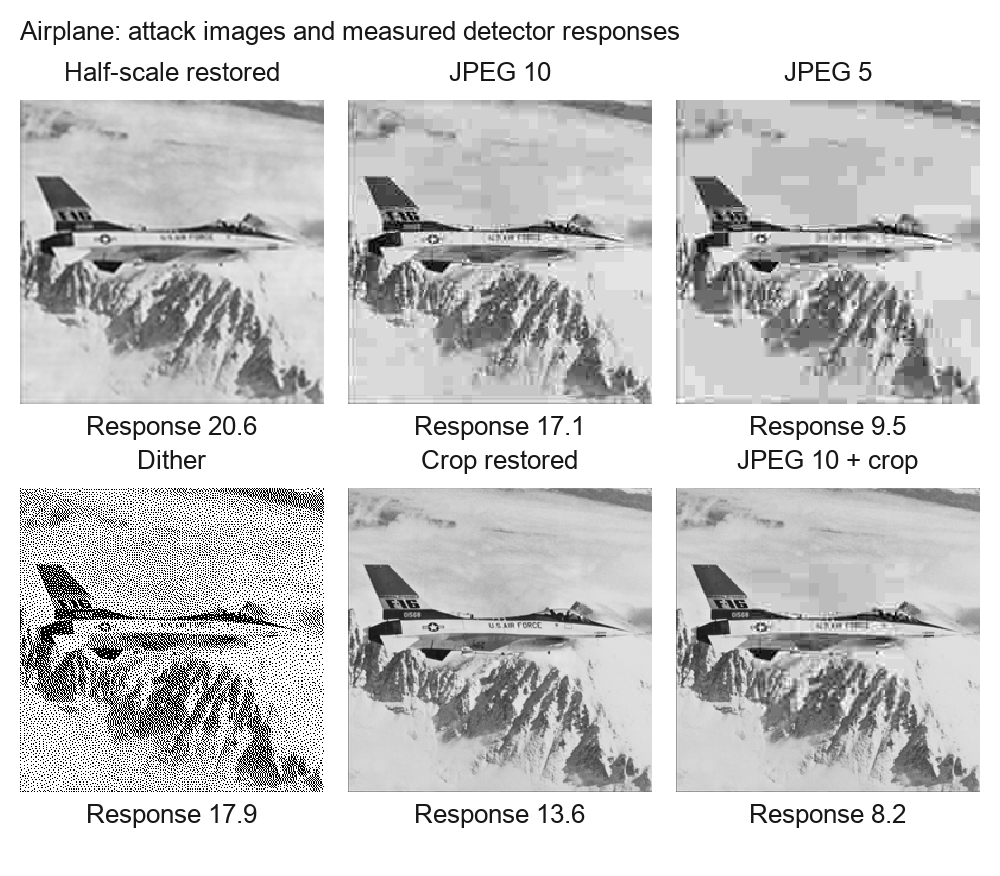
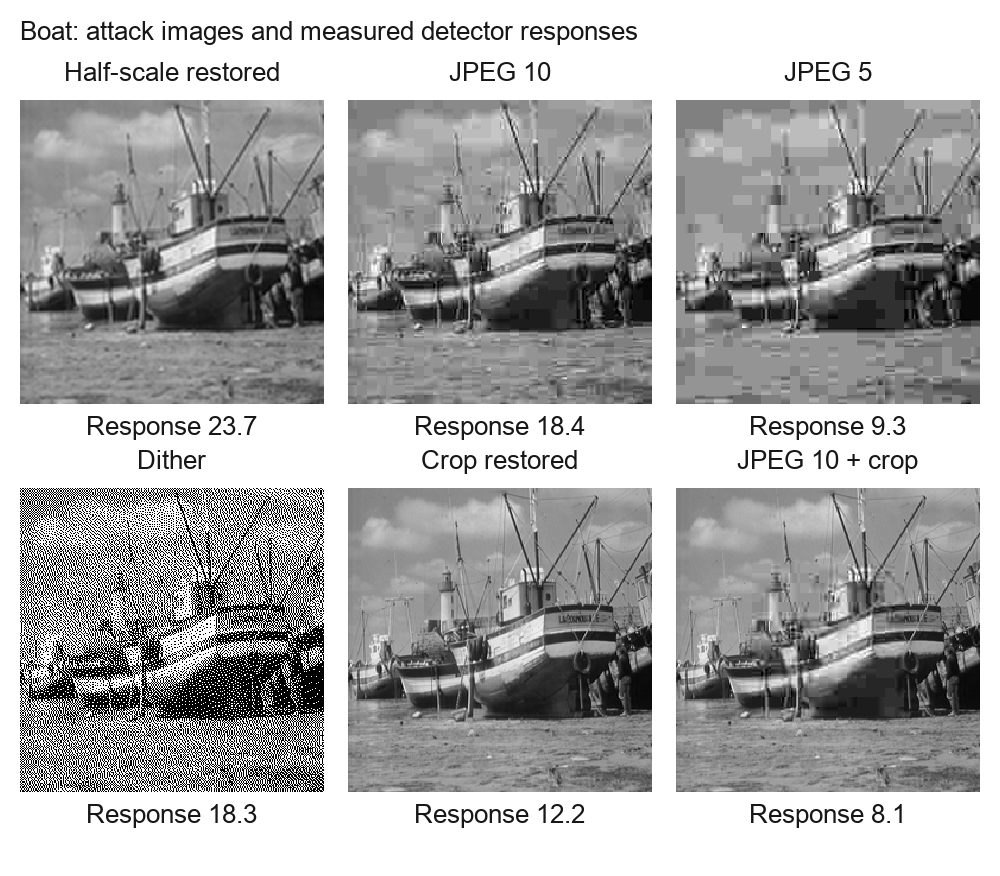
We measured the responses labeled in these panels. Crop-restored panels keep the attacked central quarter and fill the rest from the original image. In JPEG-plus-crop panels, only that quarter holds JPEG pixels.
We measured these responses, rounded to one decimal.
| Test | Airplane | Boat |
|---|---|---|
| Undistorted | 30.5 | 32.4 |
| Half-scale | 20.6 | 23.7 |
| JPEG 10 | 17.1 | 18.4 |
| JPEG 5 | 9.5 | 9.3 |
| Dither, no mean removal | 17.9 | 18.3 |
| Dither, mean removed | 18.2 | 18.7 |
| Crop | 13.6 | 12.2 |
| JPEG 10 + crop | 8.2 | 8.1 |
We also inserted five marks in a row, and separately averaged five copies that each carry a different mark. For each image, we measured all five marks in the result.
Across both images, we measured 20 responses, ranging from 12.8 to 14.9.
| Item | Setting |
|---|---|
| Seed | 199712 |
| Versions | Python 3.11.15; NumPy 2.3.5; SciPy 1.16.3; Pillow 12.0.0; libjpeg 6.2; libjpeg-turbo 3.1.2 |
| Preparation | Center-square crop; grayscale; LANCZOS resize to 256×256 |
| Scale | LANCZOS 256->128->256 |
| JPEG | Quality 10 and 5 |
| Dither | Pillow Floyd-Steinberg |
| Crop | Central 128×128 kept |
| Multiple marks | Same coefficient positions for every mark |
Conditions and limits
The authors’ detector requires the original unmarked image and registration to undo geometric changes before extraction. The scale and crop tests use known dimensions and coordinates. Automatic registration, residual misalignment, rotation, translation, and physical copying require separate evaluation. Our measurements use the displayed Airplane and Boat images.
Section VI leaves perceptually grounded component selection and registration precision across a large image set as open problems. Image fidelity and robustness depend on insertion strength and the application. The authors’ ownership-identification proposal also requires authentication beyond watermark insertion.
Implementation details
Our implementation uses SciPy for the whole-image transform and Pillow for image processing. Original coefficient positions stay fixed during successive insertions. Cropped images are restored with the unmarked original before extraction. The test settings record the resampling choice, dithering procedure, preparation, seed, and software versions.
References
- Cox, I. J., Kilian, J., Leighton, F. T., and Shamoon, T. (1997). Secure Spread Spectrum Watermarking for Multimedia. IEEE Transactions on Image Processing, 6(12), 1673-1687. DOI: 10.1109/83.650120.
- USC-SIPI Image Database. Miscellaneous catalog, including Airplane and Boat.
- Our re-implementation code and numeric results: GitHub, cox-1997-spread-spectrum.