Reversible Watermark Using the Difference Expansion of a Generalized Integer Transform (Alattar, 2004)
Alattar embeds a reversible watermark by expanding differences within groups of pixels. A reversible watermark carries a hidden message while allowing the original image to be recovered exactly. The image carries both the message and the information needed to undo embedding. The author motivates this requirement through medical and military uses and archives of valuable original works, where permanent changes may be unacceptable. The proposed generalized integer transform extends difference expansion from pixel pairs to vectors of arbitrary length. It aims to increase hiding capacity while retaining exact recovery. Adnan M. Alattar, Reversible Watermark Using the Difference Expansion of a Generalized Integer Transform (2004).
Why must the watermark restore the original pixels?
Ordinary watermarking changes the host image permanently. Alattar argues that some applications can tolerate temporary changes if decoding also restores every original pixel. Recovery must use information in the marked image itself. The hidden message is the payload; a bit is a binary digit with value zero or one.
The author extends Tian’s pixel-pair method so that a group carries several bits during one pass:
“This approach allows the algorithm to embed several bits in every vector in a single pass through the image data.”
— Alattar (2004), Section I
The design must create message space and preserve the information needed to reverse every change. Those requirements determine the transform, group selection, and embedded recovery stream.
Why transform groups into an average and differences?
A vector is an ordered group of pixel values. Alattar forms nonoverlapping vectors in a predetermined order, which may serve as a security key. Each color component can be processed independently. Nearby pixels often have similar values, so their differences can be small. The transform retains a rounded weighted average and records each remaining pixel’s difference from the first pixel.
Let N be the group size, u_i its pixel values, and a_i constant integer weights. Let A be their nonzero sum, m the integer average, and d_i the differences. Section II gives:
A = sum(a_i, i = 0,...,N-1)
m = floor(sum(a_i * u_i, i = 0,...,N-1) / A)
d_i = u_i - u_0, i = 1,...,N-1
u_0 = m - floor(sum(a_i * d_i, i = 1,...,N-1) / A)
u_i = u_0 + d_i
floor rounds downward, including negative values. The inverse reconstructs the pixels exactly despite rounding. Alattar argues that compact groups in a two-dimensional neighborhood retain pixel similarity while reducing the location map’s size.
Why double each difference to insert a bit?
Expansion creates a new least significant bit, or LSB, the final binary digit. The average remains unchanged. Section II inserts message bit b_i into difference d_i, producing marked difference d'_i. Reading its remainder after division by two extracts the bit; downward rounding after halving restores the difference:
d'_i = 2 * d_i + b_i
b_i = d'_i mod 2
d_i = floor(d'_i / 2)
Take four illustrative pixels (100, 101, 99, 100), with average 100 and differences (1, −1, 0). Embedding bits (1, 0, 1) produces differences (3, −2, 1) and pixels (100, 103, 98, 101). Taking each changed difference modulo two recovers the bits; halving each difference and rounding down restores (1, −1, 0), which reconstructs the original pixels using the unchanged average.
Why test both expansion and LSB replacement for safety?
Pixel values have a fixed range. Expanding differences can reconstruct a pixel outside that range, causing underflow or overflow. Section II defines an expandable vector as one whose reconstructed values stay between zero and 255 for every possible embedded bit combination. Clipping would discard information needed for reversal.
A changeable vector permits replacing difference LSBs safely, without doubling the differences. For replacement, the marked difference is 2 * floor(d_i / 2) + b_i. Every expandable vector is also changeable. A changeable vector remains changeable after LSB replacement. This property lets the decoder identify the bit-carrying vectors from the marked image. Alattar separates selected expandable vectors, other changeable vectors, and vectors left untouched. The displaced original LSBs of the replacement group must travel with the message.
Why embed a compressed location map with the message?
The decoder can identify changeable vectors, but needs to distinguish expansion from replacement. A binary location map marks selected expandable vectors. For adjacent spatial groups, it follows their arrangement in the image. Section III gives this embedding sequence:
- Form ordered vectors and compute their integer transforms.
- Test safety and select expandable vectors whose signed differences satisfy the thresholds.
- Compress the location map losslessly and append an end-of-stream marker.
- Save the original difference LSBs of the replacement group.
- Concatenate the compressed map, saved LSBs, and payload, in that order.
- Embed that stream by expansion or replacement and invert the transform.
Lossless compression preserves the map exactly. Alattar names arithmetic compression as one possible compressor. Saving replacement bits consumes the space those vectors carry. Section IV expresses useful capacity as the selected expansion space minus the compressed map length.
Why adjust thresholds to the desired payload?
The thresholds limit the signed differences of selected expandable vectors. They control how much space expansion creates and how much the image changes. Section IV relates capacity C to group size N, selected expandable set S_1, and compressed map bitstream B_1. Vertical bars denote an element count or bit length:
C = (N - 1) * |S_1| - |B_1|Alattar argues that a fixed payload requires adapting thresholds to the host image. Section V proposes an iterative proportional feedback controller: evaluate the actual capacity, compare it with the desired length, and update the threshold vector. Its gain controls convergence speed. The initial threshold vector sets the relative weights among difference thresholds. Large groups may require increased thresholds as their pixels become less similar, with an accompanying loss of image quality.
How does the decoder recover both the message and image?
Section III-B uses the marked image and the agreed grouping order to recover the embedded stream. The decoder follows these steps:
- Re-form vectors and compute their transforms.
- Identify changeable vectors using the replacement safety conditions.
- Read their difference LSBs in order to recover the stream.
- Locate the end-of-stream marker and decompress the location map.
- Halve expanded differences with downward rounding; restore saved LSBs in replacement vectors.
- Invert the transform, restore the pixels, and retain the remaining payload.
The unchanged average supplies the reference needed for the inverse transform. The map identifies which inverse operation applies to each changed group. The author also describes authenticating the image using the recovered watermark; recovery itself requires the embedded information to remain available.
Why repeat embedding or group color components together?
Section VI proposes recursive embedding: apply the reversible algorithm again to an already marked image. Each pass can be undone to recover its input. Alattar warns that image error accumulates with successive applications. Changing the reference pixel through vector permutations lets different passes exploit similarity within a group.
The author also proposes cross-color embedding after processing color components independently. Here, a vector contains a pixel’s red, green, and blue values, abbreviated RGB. A cross-color quad repeats green, using (R,G,G,B). Its average weights green twice, while its differences are R-G and B-G. Both cross-color forms carry two bits per selected vector. Alattar relates the quad transform to the reversible color transform in JPEG2000 and studies how channel similarity affects capacity and map compression.
All parts of the method
The embedder combines ordered grouping, the integer transform, safety tests, threshold selection, and the compressed recovery stream. Expansion creates capacity; replacement carries stream bits while preserving its displaced digits elsewhere in the stream. The decoder identifies changeable groups, reads the stream, restores the location map and saved digits, and applies the inverse transform. Repeated embedding adds another reversible layer, recovered in reverse order.
What experiments did the authors run?
Alattar reports spatial triplet and quad capacity curves, visual quality examples, cross-color capacity and map-size tests, and comparisons with Tian and Celik.
Spatial triplet capacity and visual quality
Section VII uses 512×512 RGB Lena, Baboon, and Fruits images, equal transform weights, and uniformly random binary watermarks. The difference thresholds are equal within each experiment. Spatial triplets contain three consecutive pixels. The author embeds in each color component, first along columns and then rows, and plots total payload against peak signal-to-noise ratio, or PSNR. PSNR expresses mean squared pixel error relative to the maximum pixel value, in decibels (dB).
For Fruits, Alattar reports 858 kbits at 28.52 dB and 288 kbits at 37.94 dB; a kbit denotes one thousand bits. Baboon carries 656 kbits at 21.2 dB and 115 kbits at 30.14 dB. The author attributes image-dependent capacity to pixel similarity: smooth content produces more expandable groups with less distortion. The highlighted Baboon curve is the low-capacity curve discussed in Section VII-A.
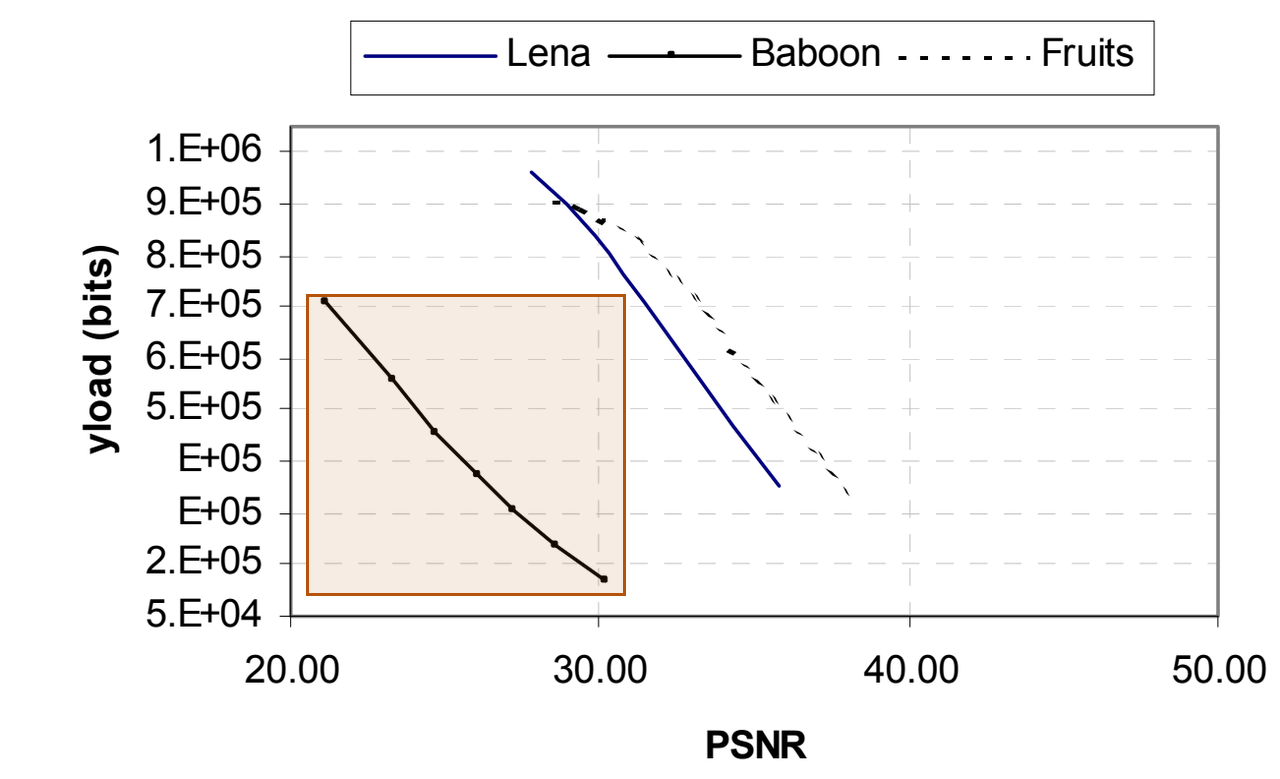
Alattar (2004), Figure 5. Baboon triplet capacity.
Figures 6 and 7 display Lena and Baboon at several embedding levels. Alattar reports that the marked images are generally hard to distinguish from their originals, but alternating their display reveals sharpening. The author reports that sharpening is more noticeable at low PSNR and in Baboon.
Spatial quad capacity and visual quality
Section VII-B uses adjacent 2×2 groups, processed independently in each color component. Fruits carries 867 kbits at 33.59 dB and 321 kbits at 43.58 dB. Baboon carries 802 kbits at 24.73 dB and 148 kbits at 36.6 dB. Alattar reports about 300,000 additional bits at the same PSNR, or about 5 dB additional PSNR at the same payload, relative to spatial triplets.
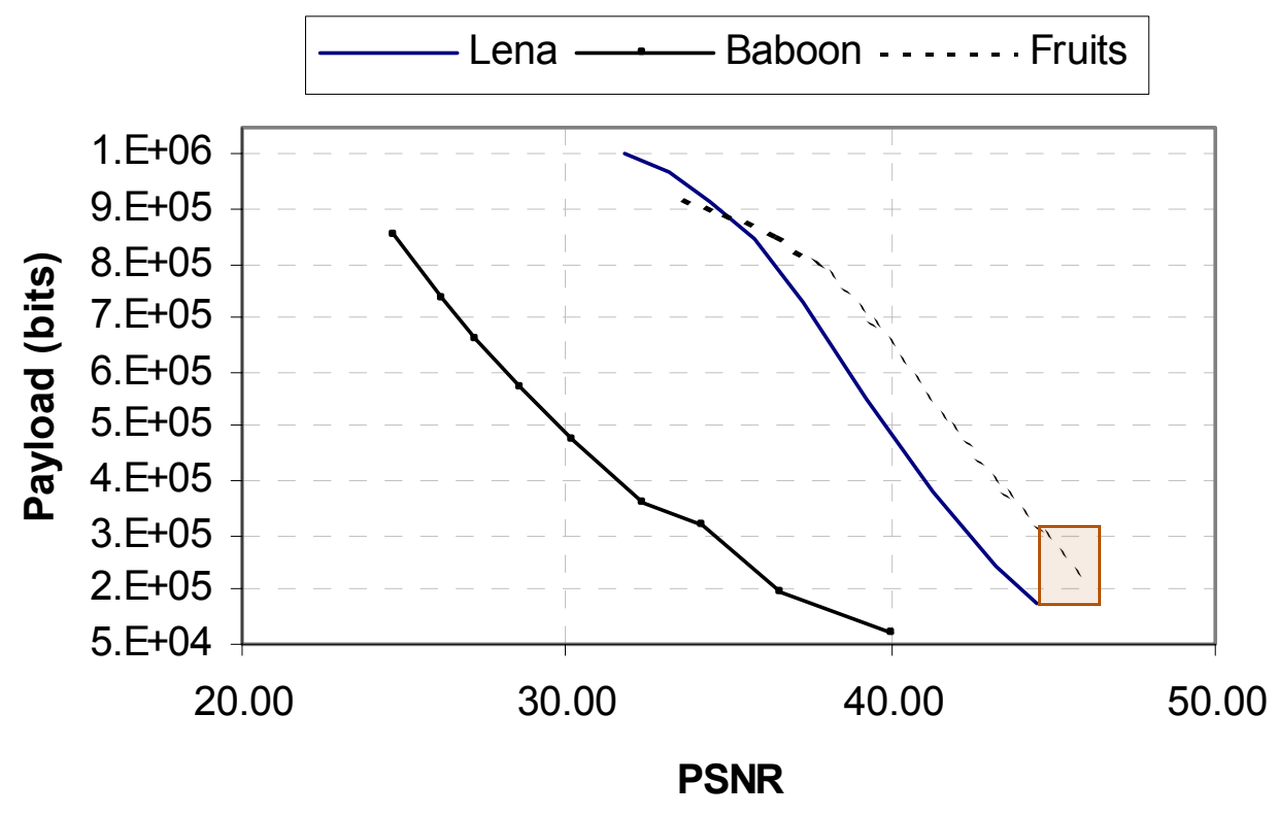
Alattar (2004), Figure 8. Fruits at high PSNR.
The author reports control over results from 38 dB to 46 dB with quads. Alattar attributes this to similarity within compact groups and a single location map smaller than either map needed for the triplet passes. Figures 9 and 10 display Lena and Baboon at different embedding levels. The author reports less visible sharpening with quads.
Cross-color triplet and quad capacity
Section VII-C groups each test image’s RGB components as cross-color triplets or quads and plots payload against PSNR in Figures 11 and 12. Alattar reports lower capacity and PSNR than for spatial groups. Both cross-color forms perform almost identically except for Lena above 30 dB, where triplets retain small payloads and quads do not. Figure 13 isolates that Lena result. The author observes that Lena’s blue channel is close to green and relates the difference to the reconstructed green channel’s available value range after expansion.
Cross-color location map size
Figure 14 plots compressed map length against PSNR for the same cross-color Lena test. Alattar reports that triplets can produce more expandable vectors and a map with lower entropy, meaning less uncertainty in its bit pattern, when red or blue is close to green. The highlighted high-PSNR portion shows the triplet map shrinking. The author connects this saving to the useful payload retained in Figure 13.
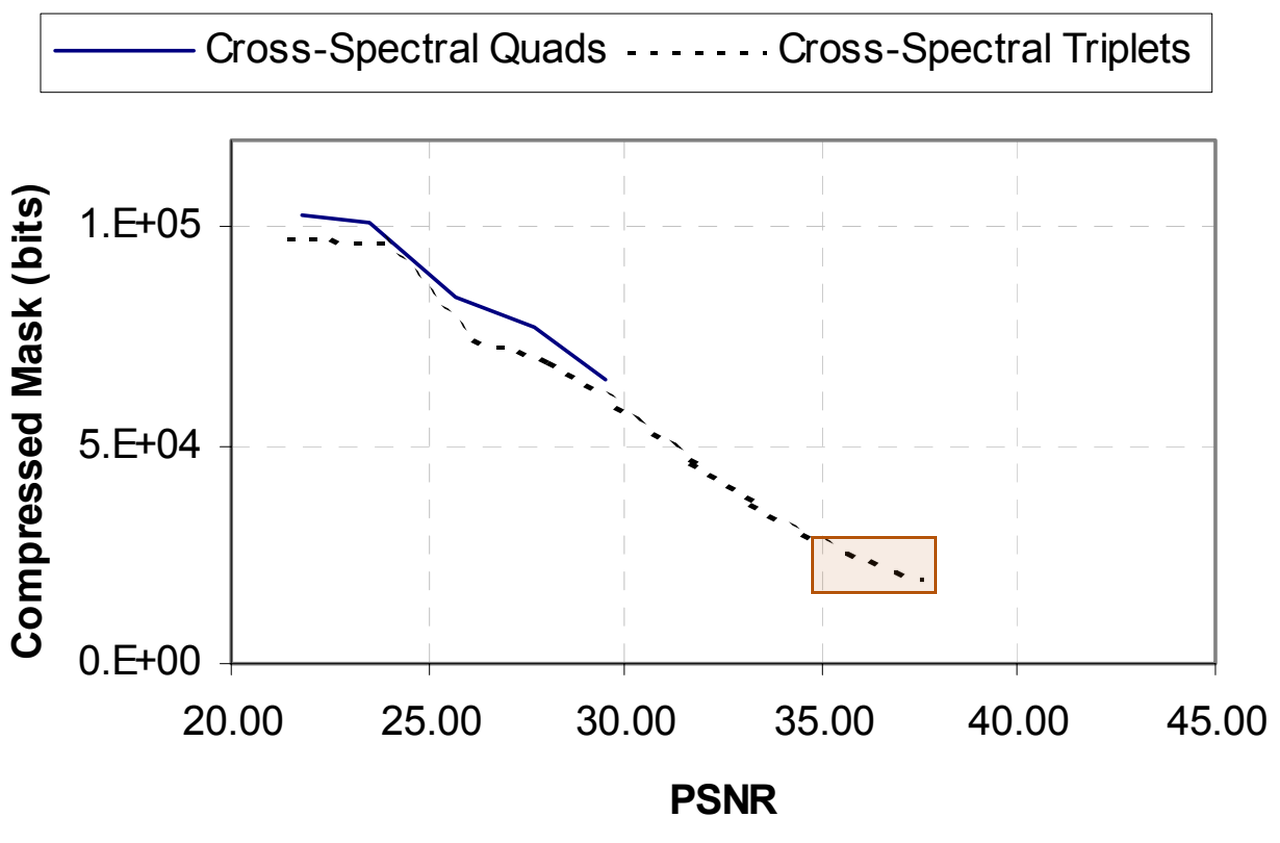
Alattar (2004), Figure 14. Lena triplet map size.
Comparison with Tian’s pixel pairs
Section VII-D uses grayscale Lena and Barbara. Figure 15 compares spatial triplets with Tian’s pairs: Alattar reports an advantage at low PSNR, while Tian has an advantage at high PSNR. Figure 16 compares quads with pairs. The author reports an advantage for quads above 35 dB and a marginal advantage for Tian below it. Quads process the image once; Tian’s method uses column and row passes.
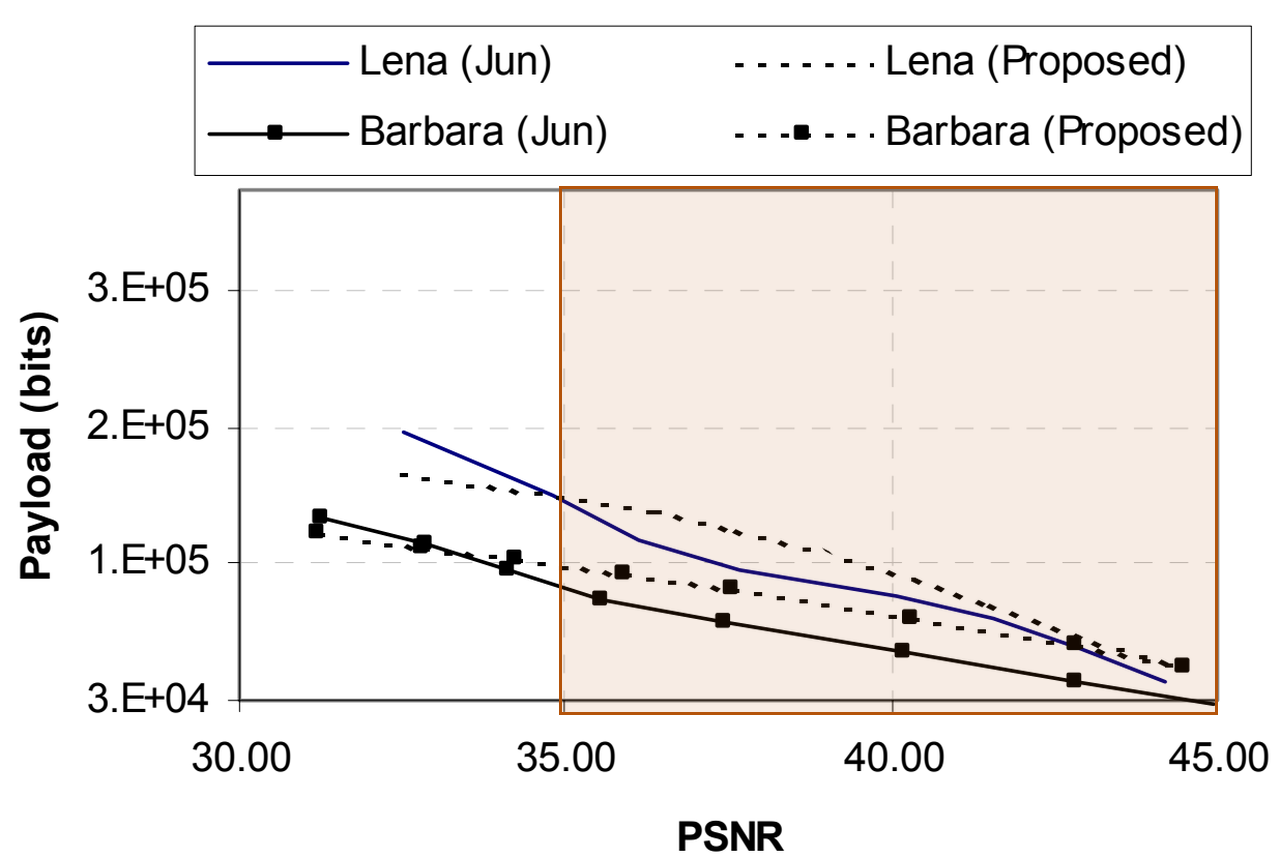
Alattar (2004), Figure 16. Quad comparison above 35 dB.
Comparison with Celik’s reversible embedding
Figures 17 and 18 use grayscale Lena and Barbara. Alattar reports that triplets outperform Celik’s method at low PSNR and have similar performance at high PSNR. The author reports that quads outperform Celik’s method at almost all plotted PSNRs. The conclusion presents adding cross-color embedding after spatial embedding as useful when large payloads matter without regard to marked-image quality.
Our test: payload and exact recovery
We re-implemented the method ourselves because we did not find the author’s code. Our code and numeric results are on GitHub.
| Setting | Value |
|---|---|
| Images | Airplane; Boat |
| Preparation | 512×512; one brightness value from 0 to 255 per pixel (8-bit grayscale) |
| Triplets | 3×1, then 1×3 |
| Quads | 2×2; top-left first |
| Thresholds | 12, 16, 24, 32, 48, 64 |
The inputs are USC-SIPI Airplane and Boat. Each setting uses a random binary message that fills the available useful space. Payload excludes the compressed selection map, saved digits, and the header that describes the embedded stream. PSNR measures the marked image’s error relative to the grayscale input.
The panels show original, marked, difference, and restored images at threshold 24. Absolute differences discard the direction of a brightness change. They are amplified eight times for visibility and clipped to the display range. The restored panels show exact recovery from the marked images.
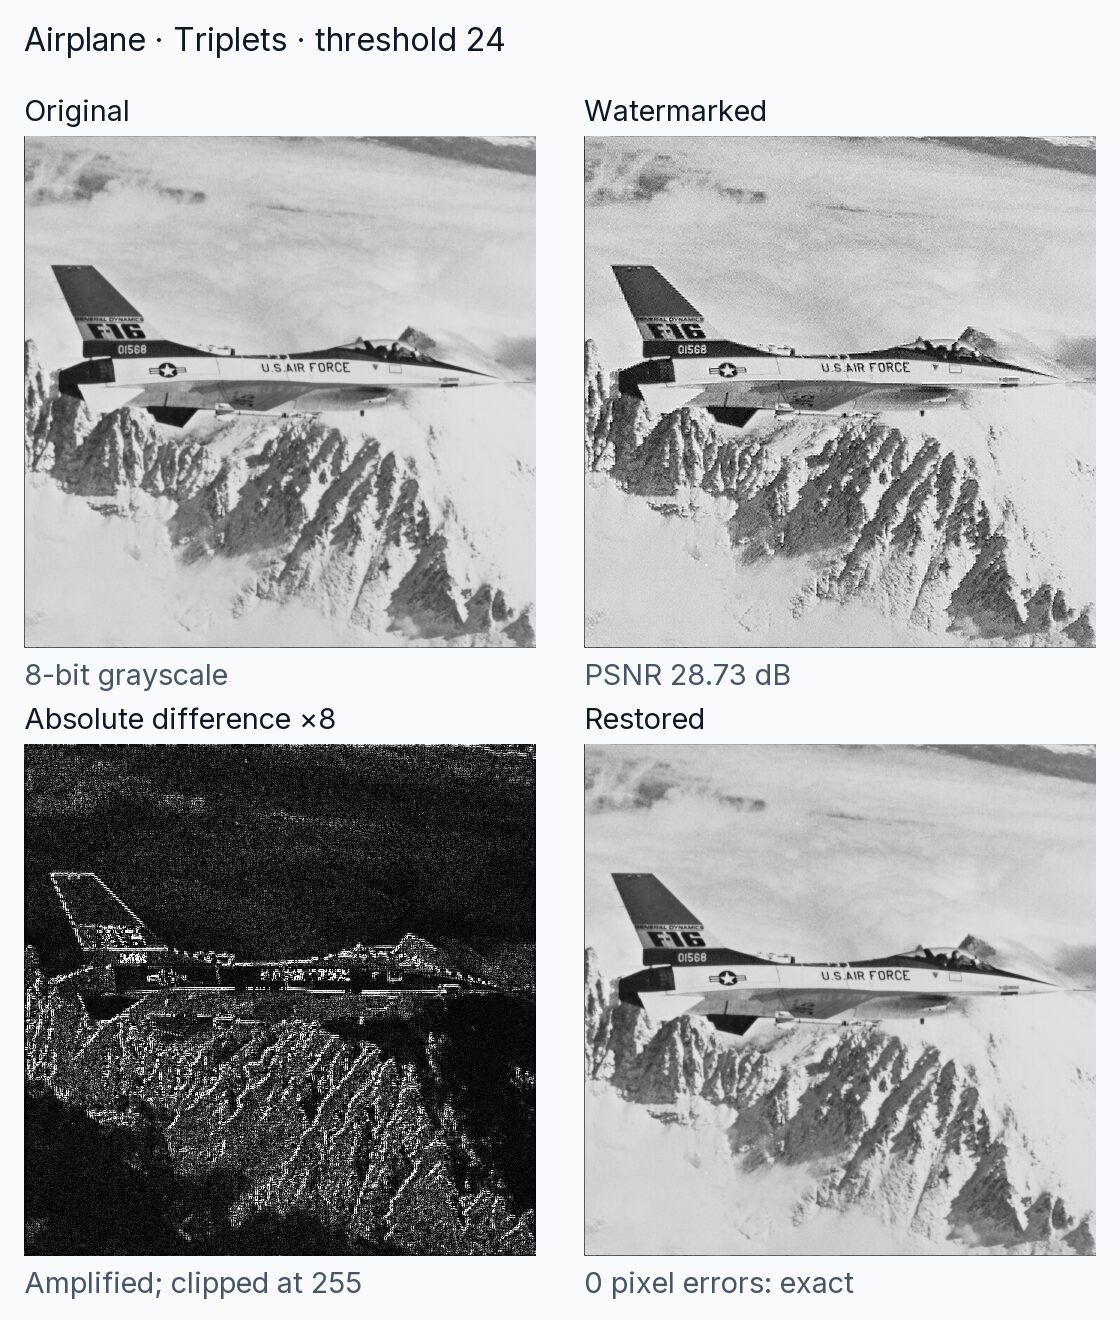
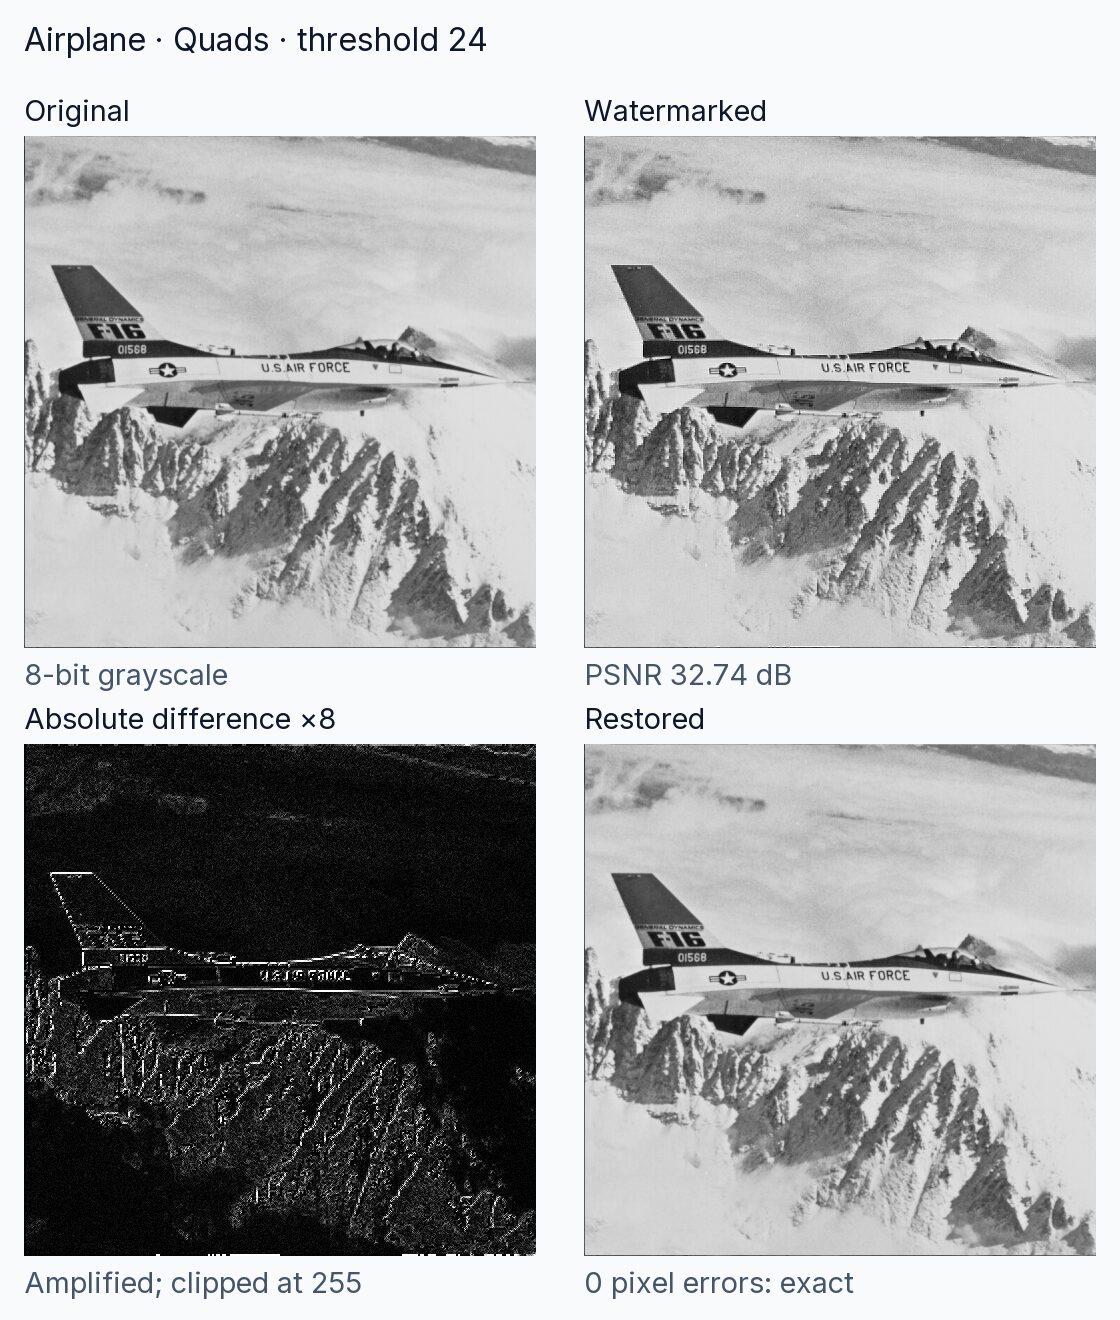
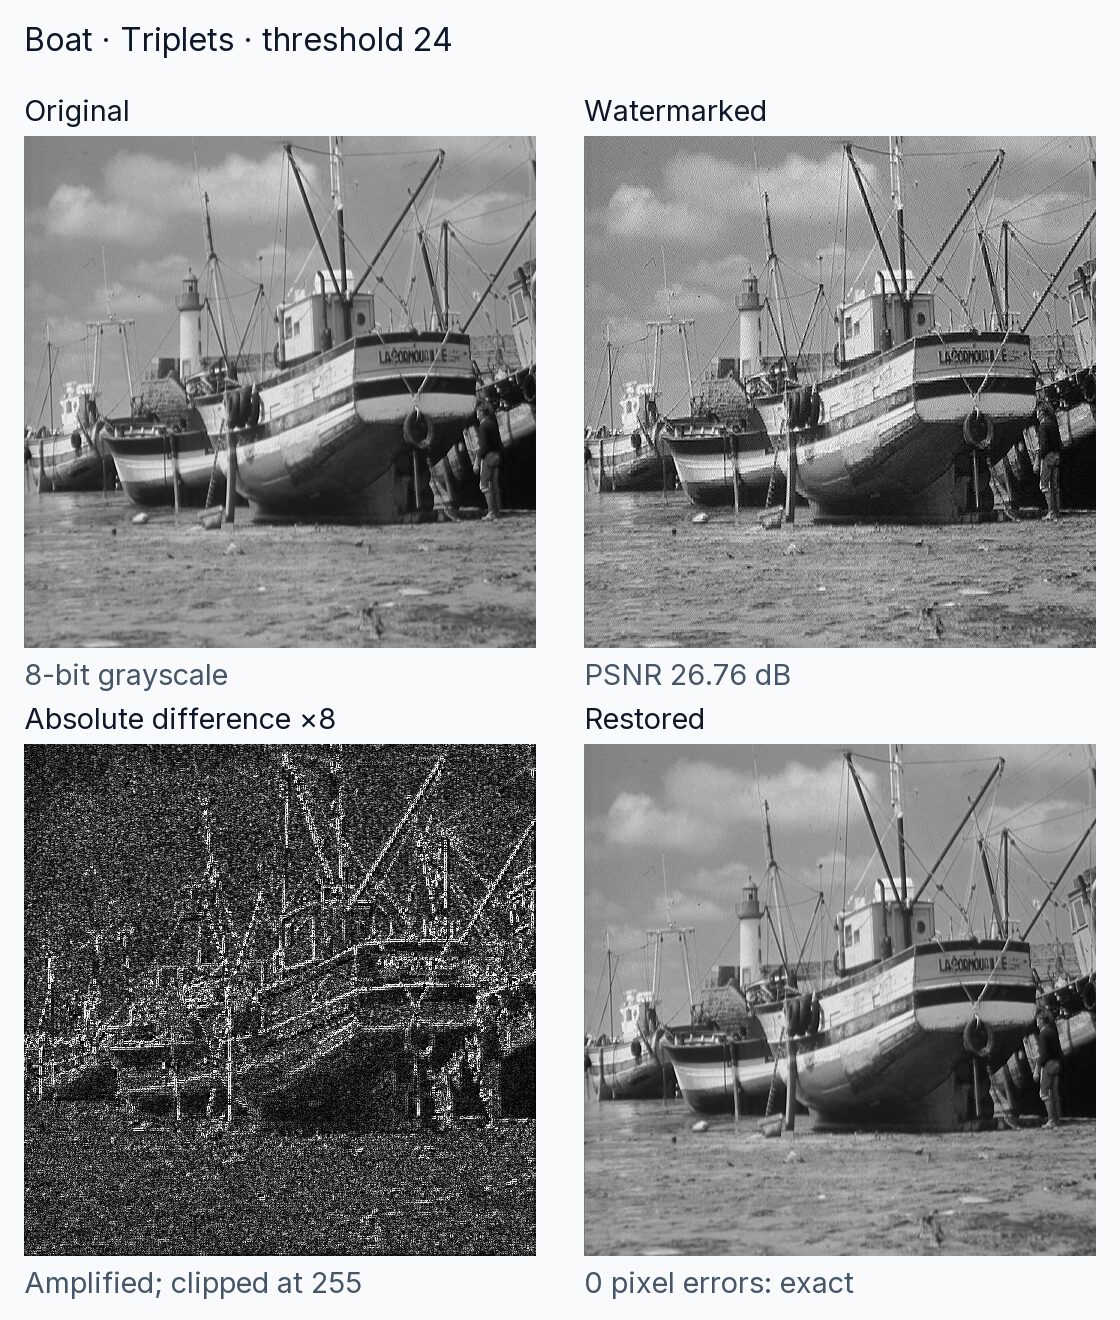
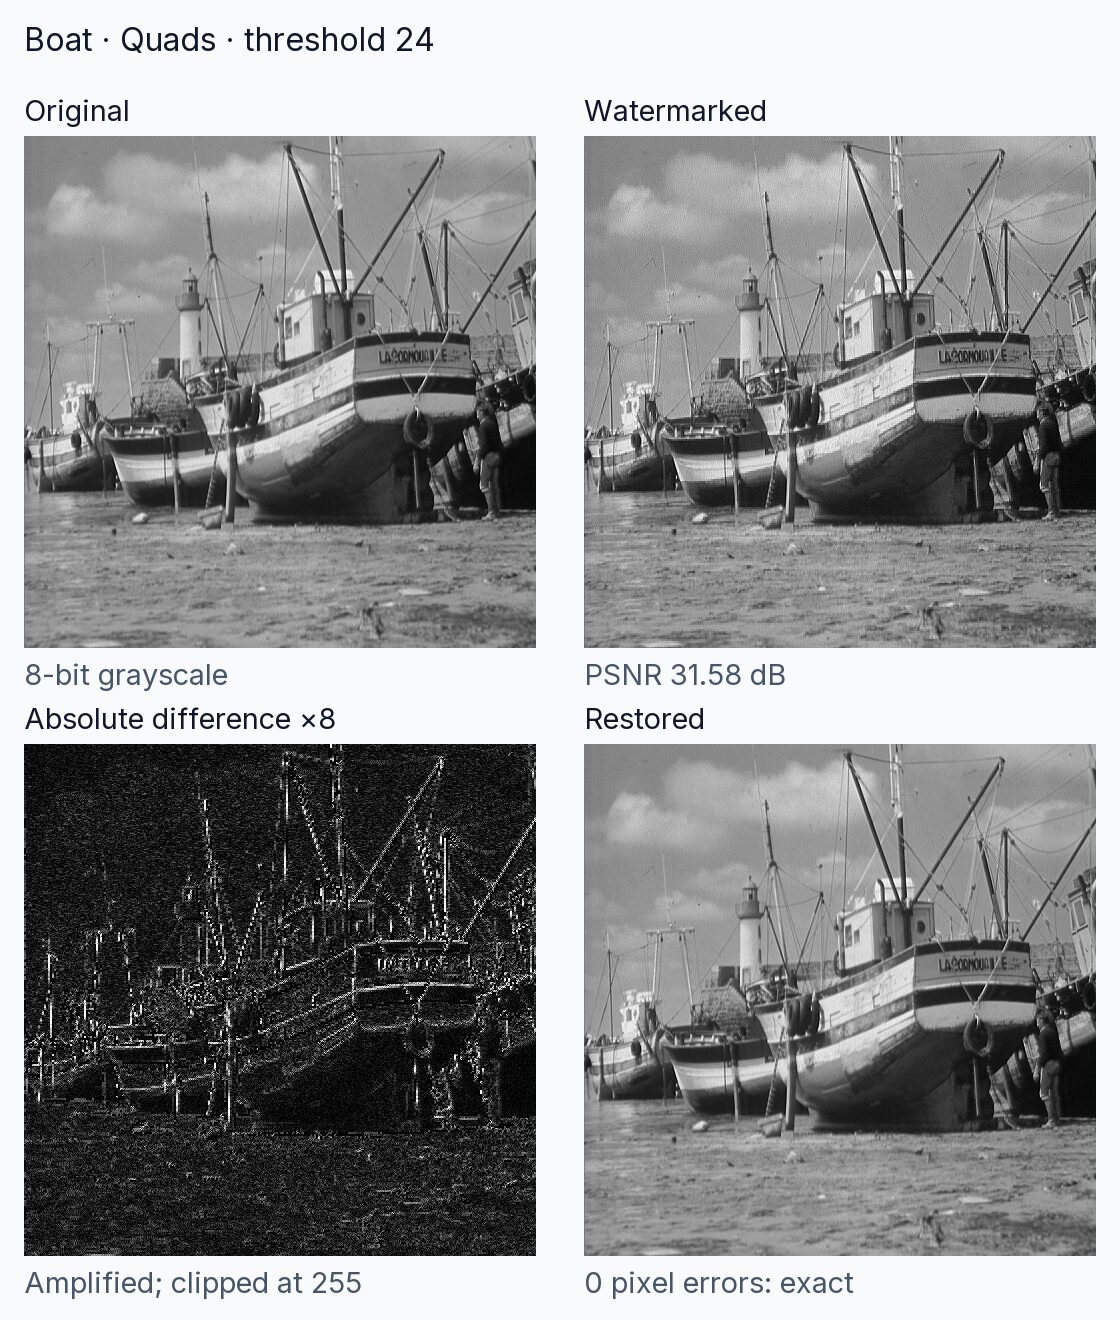
These are the measured payloads and PSNR values for the displayed images:
| Image | Group | Bits | PSNR |
|---|---|---|---|
| Airplane | Triplets | 275,590 | 28.73 dB |
| Airplane | Quads | 166,107 | 32.74 dB |
| Boat | Triplets | 247,296 | 26.76 dB |
| Boat | Quads | 157,106 | 31.58 dB |
Each chart point represents one tested threshold. Along each curve, increasing the threshold increased useful payload and reduced PSNR. The triplet curves include both embedding passes; the quad curves include one pass. Across every tested setting, extraction returned the complete message with zero bit errors and restored the input with zero changed pixels. Recovery used the marked image and grouping order alone.
We used lossless image storage and extraction. Each run used equal weights, fixed grouping, and random messages generated from the fixed starting value 200408.
| Item | Setting |
|---|---|
| Random messages | Fixed starting value 200408 |
| Preparation | Convert to one brightness value per pixel; no resizing |
| Weights | All one |
| Map | Packed bits; DEFLATE level 9 |
| Header | 96 bits per pass |
| Borders | Incomplete triplets unchanged |
| Recovery | Reverse pass order; downward rounding |
Conditions and limits
Exact reversal requires the marked pixel values and embedded recovery information to remain intact. The decoder needs the grouping order and stream format shared with the embedder. Alattar’s recursive scheme accumulates distortion even though each embedding layer remains reversible. Its capacity depends on the image and the compressed location map. The author’s conclusion favors spatial grouping when marked-image quality matters. Our measurements use grayscale spatial groups and lossless storage. Compression attacks, cropping, added noise, cross-color grouping, automatic threshold control, and image authentication were outside our test.
Implementation details
Our implementation uses DEFLATE, a lossless compressor, for the packed location map and a length header to separate the stream’s parts. It reverses embedding passes in order and uses downward rounding for signed differences. Incomplete groups at image borders retain their original pixels.
References
- Alattar, A. M. (2004). Reversible Watermark Using the Difference Expansion of a Generalized Integer Transform. IEEE Transactions on Image Processing, 13(8), 1147–1156. DOI: 10.1109/TIP.2004.828418. Full manuscript.
- USC-SIPI Image Database. Miscellaneous volume: Airplane and Boat. University of Southern California. Catalog.
- Our re-implementation code and numeric results: GitHub, alattar-2004-integer-transform.